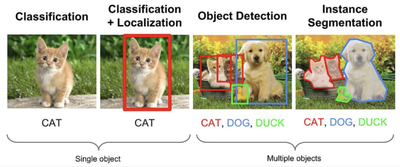
目标检测的朴素方法(老方法):图像分块(小区域=titles),逐块分诶(单区域运行CNN分类器判断是否含目标物体),阈值筛选(选择分类置信度高于设定阈值区域作为检测结果)
代码:用TensorFlow + Keras
import cv2
from tensorflow import keras
import numpy as np
import matplotlib.pyplot as plt
import os
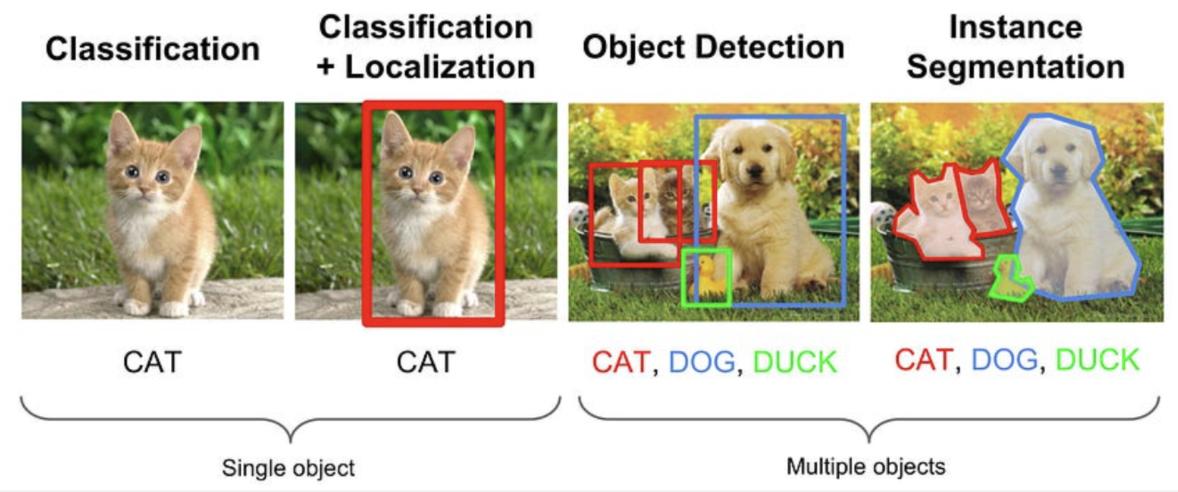
img = cv2.imread('images/1200px-Girl_and_cat.jpg')
img = cv2.cvtColor(img,cv2.COLOR_BGR2RGB)
img = np.pad(img,((158,158),(0,0),(0,0)),mode='edge')
plt.imshow(img)
用预训练VGG-16 CNN:
vgg = keras.applications.vgg16.VGG16(weights='imagenet')
定义猫的概率预测函数:
ImageNet有不同猫类(#218-294),通过累积类别的预测概率计算图像中有猫的整体概率
def predict(img):
im = cv2.resize(img,(224,224))
im = keras.applications.vgg16.preprocess_input(im)
pr = vgg.predict(np.expand_dims(im,axis=0))[0]
return np.sum(pr[281:294]) # we know that VGG classes for cats are from 281 to 294
predict(img)
输出:0.61825
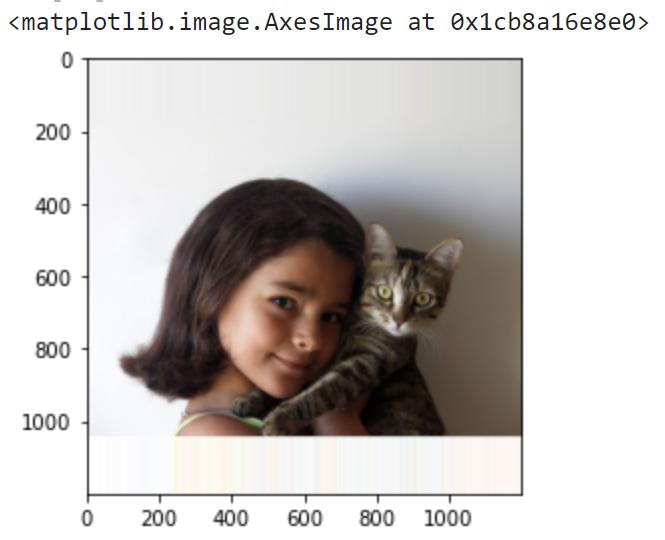
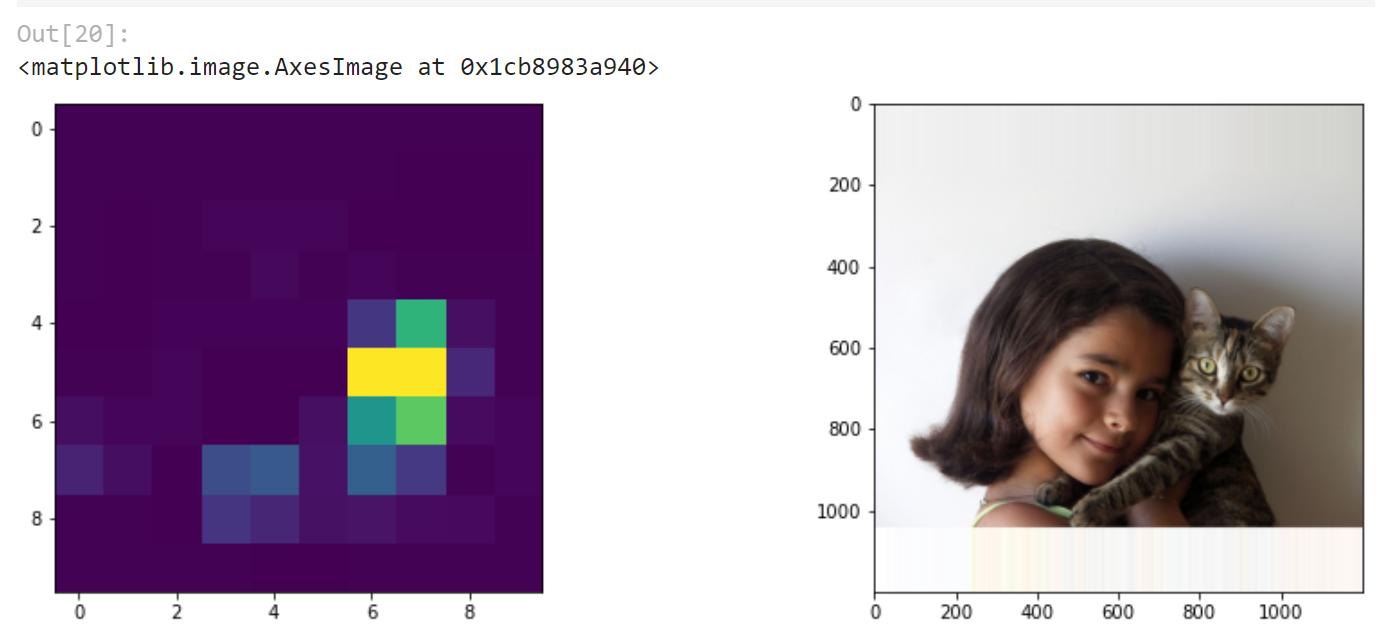
概率热图(nxn):
def predict_map(img,n):
dx = img.shape[0] // n
res = np.zeros((n,n),dtype=np.float32)
for i in range(n):
for j in range(n):
im = img[dx*i:dx*(i+1),dx*j:dx*(j+1)]
r = predict(im)
res[i,j] = r
return res
fig,ax = plt.subplots(1,2,figsize=(15,5))
ax[1].imshow(img)ax[0].imshow(predict_map(img,10))
精确定位边界框位置,运行回归模型预测坐标,32x32图检测黑色矩形
def generate_images(num_imgs, img_size=8, min_object_size = 1, max_object_size = 4):
bboxes = np.zeros((num_imgs, 4))
imgs = np.zeros((num_imgs, img_size, img_size)) # set background to 0
for i_img in range(num_imgs):
w, h = np.random.randint(min_object_size, max_object_size, size=2)
x = np.random.randint(0, img_size - w)
y = np.random.randint(0, img_size - h)
imgs[i_img, x:x+w, y:y+h] = 1. # set rectangle to 1
bboxes[i_img] = [x, y, w, h]
return imgs, bboxes
imgs, bboxes = generate_images(100000)
print(f"Images shape = {imgs.shape}")
print(f"BBoxes shape = {bboxes.shape}")
结果:
Images shape = (100000, 8, 8) BBoxes shape = (100000, 4)
将网络输出的便捷左边 / 图尺寸,范围限制[0,1]
代码:
bb = bboxes/8.0
bb[0]
输出:
array([0, 0.25, 0.125, 0.25])
目标检测模型设计:
模型选择:看是什么任务(简单,复杂);简单任务(规则形状)用DNN,复杂(真实物体)用CNN
训练配置:优化器(随机梯度下降SGD),巡视函数(MSE,任务回归可预测坐标值)
代码:
model = keras.Sequential([
keras.layers.Flatten(input_shape=(8,8)),
keras.layers.Dense(200, activation='relu'),
keras.layers.Dropout(0.2),
keras.layers.Dense(4)])
model.compile('sgd','mse')
model.summary()
输出:
Model: "sequential_25" _________________________________________________________________ Layer (type) Output Shape Param # ================================================================= flatten_24 (Flatten) (None, 64) 0 dense_50 (Dense) (None, 200) 13000 dropout_3 (Dropout) (None, 200) 0 dense_51 (Dense) (None, 4) 804 ================================================================= Total params: 13,804 Trainable params: 13,804 Non-trainable params: 0 _________________________________________________________________
输入数据归一化(减去均值,除以标准差),略微提高性能:
imgs_norm = (imgs-np.mean(imgs))/np.std(imgs)
model.fit(imgs_norm,bb,epochs=30)
结果:略;观察到损失值低,可用更直观的指标(mAP平均精度均值)衡量效果
先定义两个边界框的交并比(IOU)指标:
def IOU(bbox1, bbox2): '''Calculate overlap between two bounding boxes [x, y, w, h] as the area of intersection over the area of unity'''
x1, y1, w1, h1 = bbox1[0], bbox1[1], bbox1[2], bbox1[3]
x2, y2, w2, h2 = bbox2[0], bbox2[1], bbox2[2], bbox2[3]
w_I = min(x1 + w1, x2 + w2) - max(x1, x2)
h_I = min(y1 + h1, y2 + h2) - max(y1, y2)
if w_I <= 0 or h_I <= 0: # no overlap
return 0.
I = w_I * h_I
U = w1 * h1 + w2 * h2 - I
return I / U
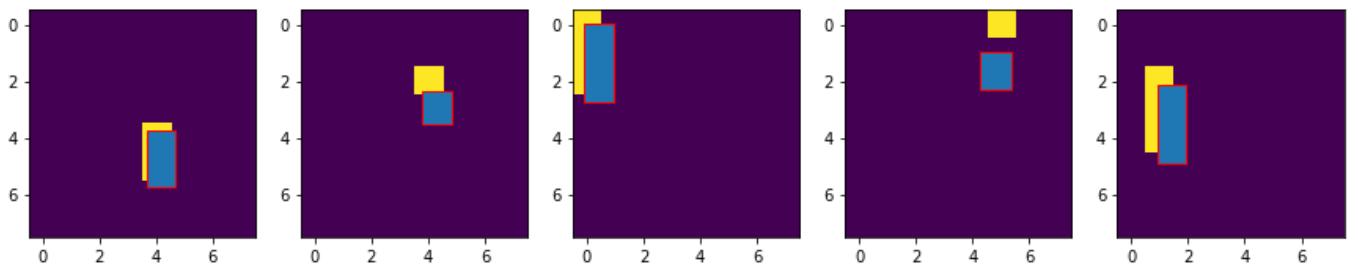
生成500张测试图像,绘制前5张,用来可视化检测精度,输出IOU:
import matplotlib
test_imgs, test_bboxes = generate_images(500)bb_res = model.predict((test_imgs-np.mean(imgs))/np.std(imgs))*8
plt.figure(figsize=(15,5))for i in range(5):
print(f"pred={bb_res[i]},act={test_bboxes[i]}, IOU={IOU(bb_res[i],test_bboxes[i])}")
plt.subplot(1,5,i+1)
plt.imshow(test_imgs[i])
plt.gca().add_patch(matplotlib.patches.Rectangle((bb_res[i,1],bb_res[i,0]),bb_res[i,3],bb_res[i,2],ec='r'))
#plt.annotate('IOU: {:.2f}'.format(IOU(bb_res[i],test_bboxes[i])),(bb_res[i,1],bb_res[i,0]+bb_res[i,3]),color='y')
输出:
pred=[3.7325673 3.6551285 2.0126944 1.030895 ],act=[4. 4. 2. 1.], IOU=0.41607480412565545 pred=[2.3762555 3.755858 1.1647941 1.0540264],act=[2. 4. 1. 1.], IOU=0.2932611042051458 pred=[-0.04900682 -0.10628867 2.7881489 1.027148 ],act=[0. 0. 3. 1.], IOU=0.7548650953478908 pred=[0.96806276 4.267275 1.3179774 1.1021365 ],act=[0. 5. 1. 1.], IOU=0.004833667961256898 pred=[2.157959 0.94667876 2.7568097 0.96259 ],act=[2. 1. 3. 1.], IOU=0.7965311752734529
计算平均精度(计算IoU,再算平均):
np.array([IOU(a,b) for a,b in zip(test_bboxes,bb_res)]).mean()
输出:
0.7150587956049862
真实物体的物体检测复杂,要跟这个学:
https://keras.io/examples/vision/retinanet/
扩展阅读:
-
用Hollywood heads数据库做硬监测