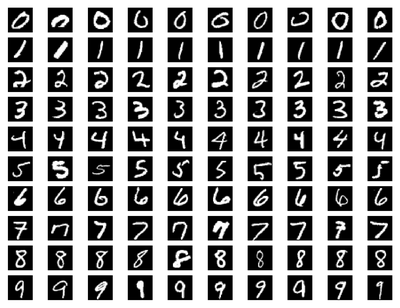
加载MNIST数据集:
with gzip.open('../../data/mnist.pkl.gz', 'rb') as mnist_pickle:
MNIST = pickle.load(mnist_pickle)
绘图:
print(MNIST['Train']['Features'][0][130:180])
print(MNIST['Train']['Labels'][0])
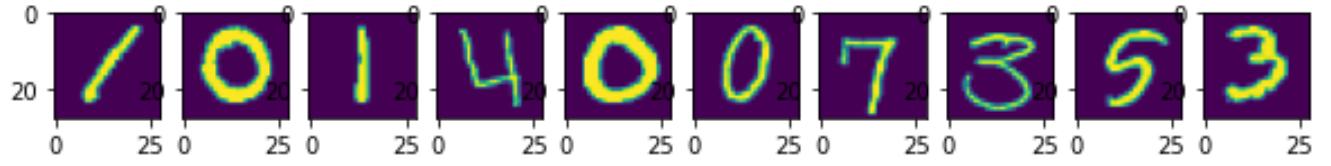
features = MNIST['Train']['Features'].astype(np.float32) / 256.0
labels = MNIST['Train']['Labels']fig = pylab.figure(figsize=(10,5))
for i in range(10):
ax = fig.add_subplot(1,10,i+1)
pylab.imshow(features[i].reshape(28,28))
pylab.show()
def set_mnist_pos_neg(positive_label, negative_label):
positive_indices = [i for i, j in enumerate(MNIST['Train']['Labels'])
if j == positive_label]
negative_indices = [i for i, j in enumerate(MNIST['Train']['Labels'])
if j == negative_label]
positive_images = MNIST['Train']['Features'][positive_indices]
negative_images = MNIST['Train']['Features'][negative_indices]
fig = pylab.figure()
ax = fig.add_subplot(1, 2, 1)
pylab.imshow(positive_images[0].reshape(28,28), cmap='gray', interpolation='nearest')
ax.set_xticks([])
ax.set_yticks([])
ax = fig.add_subplot(1, 2, 2)
pylab.imshow(negative_images[0].reshape(28,28), cmap='gray', interpolation='nearest')
ax.set_xticks([])
ax.set_yticks([])
pylab.show()
return positive_images, negative_images
调用数字1,0:
pos1,neg1 = set_mnist_pos_neg(1,0)
def plotit2(snapshots_mn,step):
fig = pylab.figure(figsize=(10,4))
ax = fig.add_subplot(1, 2, 1)
pylab.imshow(snapshots_mn[step][0].reshape(28, 28), interpolation='nearest')
ax.set_xticks([])
ax.set_yticks([])
pylab.colorbar()
ax = fig.add_subplot(1, 2, 2)
ax.set_ylim([0,1])
pylab.plot(np.arange(len(snapshots_mn[:,1])), snapshots_mn[:,1])
pylab.plot(step, snapshots_mn[step,1], "bo")
pylab.show()def pl3(step): plotit2(snapshots_mn,step)def pl4(step): plotit2(snapshots_mn2,step)
snapshots_mn = train_graph(pos1,neg1,1000)
interact(pl3, step=widgets.IntSlider(value=0, min=0, max=len(snapshots_mn) - 1))
输出:
<function __main__.pl3(step)>
调用数字2,5:
snapshots_mn2 = train_graph(pos2,neg2,1000)
interact(pl4, step=widgets.IntSlider(value=0, min=0, max=len(snapshots_mn2) - 1))
输出:
<function __main__.pl4(step)>
结论:85%准确率下的2和5还是不好分,先用PCA方法论理解问题的发生(机器学习里将输入数据集的维度降低,然后拆分类);一个输入图像有784像素,用PCA把参数降为两个
from sklearn.decomposition import PCA
def pca_analysis(positive_label, negative_label):
positive_images, negative_images = set_mnist_pos_neg(positive_label, negative_label)
M = np.append(positive_images, negative_images, 0)
mypca = PCA(n_components=2)
mypca.fit(M)
pos_points = mypca.transform(positive_images[:200])
neg_points = mypca.transform(negative_images[:200])
pylab.plot(pos_points[:,0], pos_points[:,1], 'bo')
pylab.plot(neg_points[:,0], neg_points[:,1], 'ro')
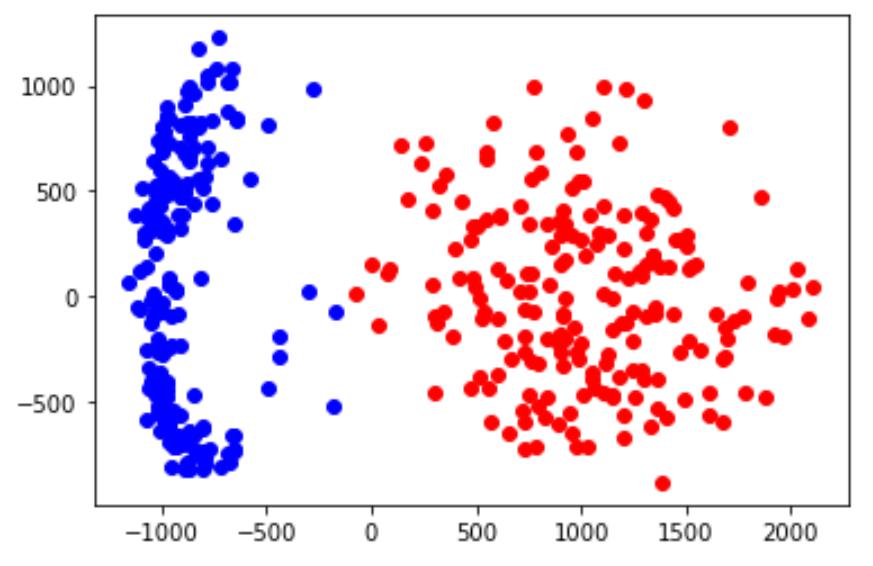
调用1,0:
pca_analysis(1,0)
再绘图:
调用2,5再绘图:
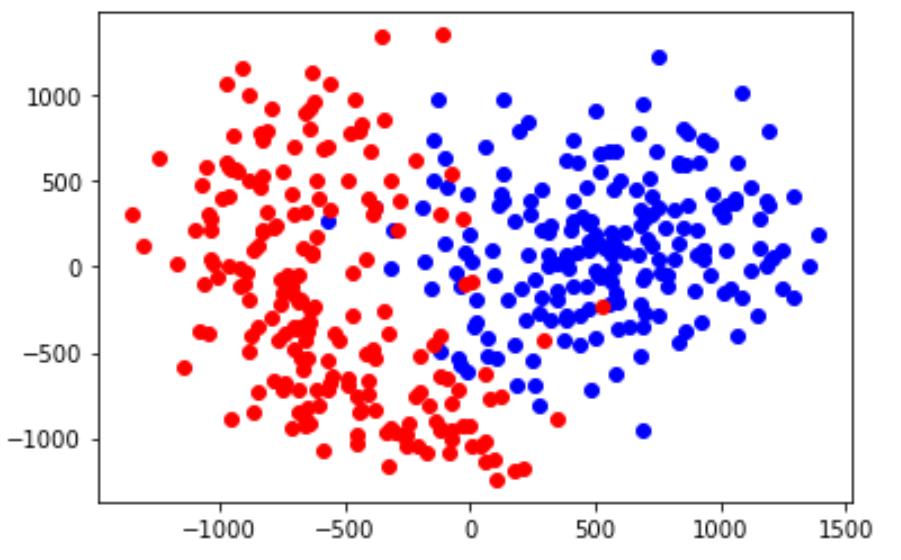
结论:2,5不能分开,说明分类有错;1和0分开说明是线性分开,2,5不是,单纯感知器无法解决